1. Prerequisite:
1. At least one host pool must be configured in advance.
2. Create a Log Analytics Workspace:
Log Analytics workspace is needed to collect counters and events for your Azure Virtual Desktop session hosts.
1. Search for Log Analytics in the Global Search. Click on +Create.

3. Give a suitable name.
4. Select the Region.
5. Click on Review +Create and then Create.
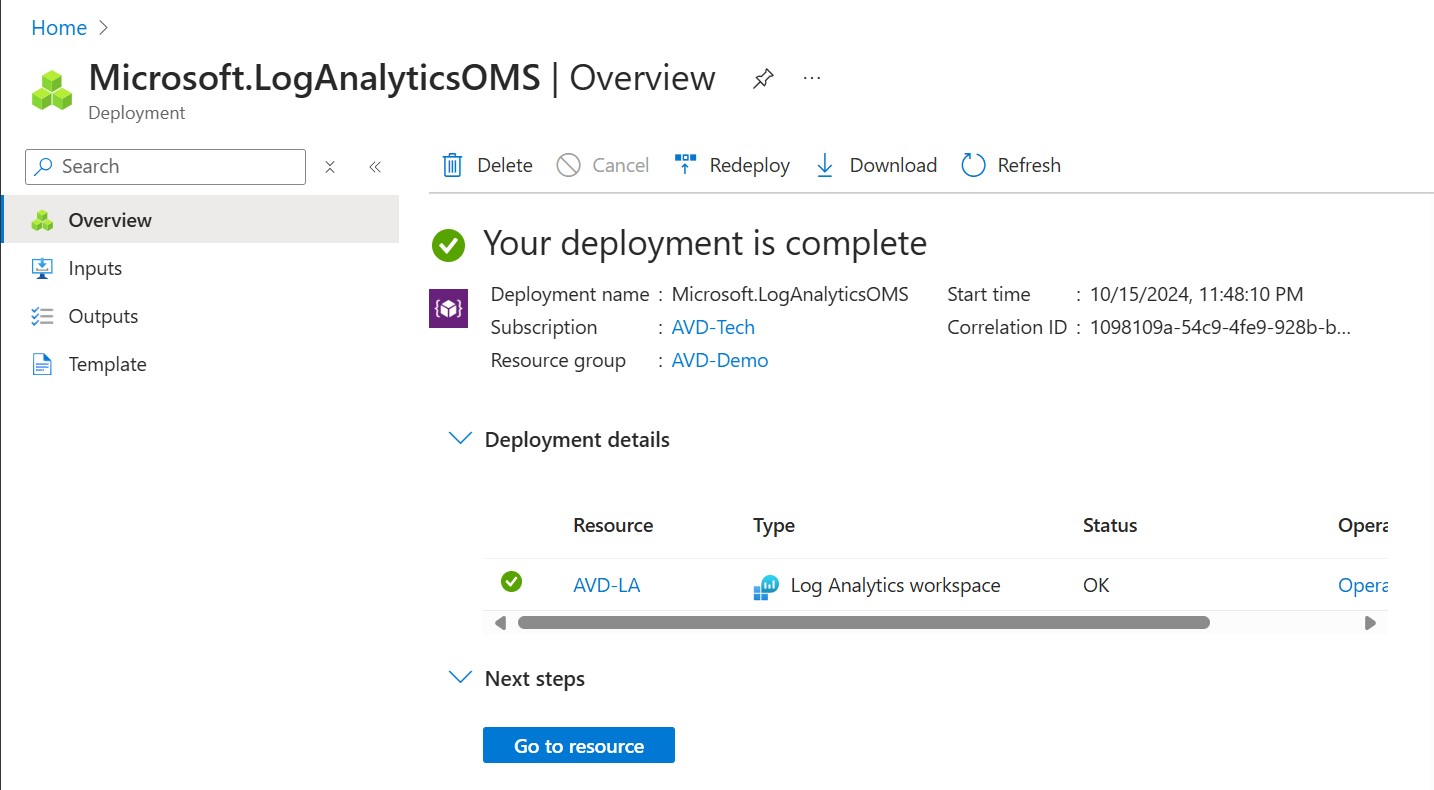
 6. Log Analytics Workspace is created successfully.

3. Host Pool Diagnostic Settings:
1. Search for Azure Virtual Desktop in the Global search.
2. Under Manage click on Host pools.

3. Select the Host pool.

4. Under Monitoring, click on Diagnostic settings.

5. Click on +Add diagnostic setting

6. Give a suitable name.
7. Under Logs- Category groups check the box for allLogs.
8. Under Destination Details, check the box for Send to Log Analytics Workspace.
9. Select the appropriate subscription and Log Analytics Workspace.
10. Click on Save.

4. Application Group Diagnostic Settings:
1. Search for Azure Virtual Desktop in the Global search.
2. Under Manage click on Application Groups.
3. Click on Hostpool1-DAG

4. Under Monitoring, click on Diagnostic settings.

5. Click on +Add diagnostic setting

7. Under Logs- Category groups check the box for allLogs.
8. Under Destination Details, check the box for Send to Log Analytics Workspace.
9. Select the appropriate subscription and Log Analytics Workspace.
10. Click on Save.


5. Workspace Diagnostic Settings:
1. Search for Workspace in the Global Search.
2. Select the workspace that is created.


5. Give a suitable name.
6. Under Logs- Category groups check the box for allLogs.
7. Under Destination Details, check the box for Send to Log Analytics Workspace.
8. Select the appropriate subscription and Log Analytics Workspace.
9. Click on Save.

6. Set up the configuration workbook:
1. Search for Azure Virtual Desktop in the Global search.
2. Under Monitoring, click on Insights.

3. Scroll down to the bottom and click on Configuration Workbook.


5. Under Workspace destination select the Log Analytics workspace.
6. Click on Create data collection rule.

7. Click on Deploy.

8. Under Selected DCR, select the DCR that just got created.
9. Under DCR associations, click on Deploy Association.


11. Scroll down a bit, under Session hosts missing Azure Monitor extension click on Add extension.

12. Click on Deploy.

13. Scroll down a bit, click on Add system managed identity.

14. Click on Add system managed identity.

7. Performance Counters and Event Logs configured:
1. Search for Log Analytics in the global search and click on the one we created.

3. Click on Data Collection Rules.


4. Click on the DCR Rule.

6. Click on Performance Counters.

NOTE: The lesser the sampling rate, more the cost.


10. Under Basic tab, you can see the overall event logs configured.


8. Create a Customized Dashboard:
1. Search for Dashboard hub in the global search and click on Get Started.


3. Give a name to the dashboard and click on Save.

4. Dashboard is created successfully.

5. You can customize the dashboard according to your requirements. In step 9, I have explained how to add these details to the dashboard.

9. Custom KQL Queries:
Go to Log Analytics Workspace and click on Logs and you can type your desired query in the given space and click on Run.

let CompletedIDs = WVDConnections
| where State == "Completed"
| project CorrelationId;
WVDConnections
| where CorrelationId !in (CompletedIDs)
| where State != "Started"
| project UserName, State, TimeGenerated

- You can click on the 3 horizontal dots-->Pin to-->Azure Dashboard

- While creating the dashboard, you have the option if you wish to make it Private or Shared. Select the Dashboard that is created. Click on Pin.

- You can similarly pin other KQL queries as well to the Dashboard if required.
let CpuData = Perf
| where ObjectName == "Processor Information" and CounterName == "% Processor Time"
| summarize AvgCpu = avg(CounterValue) by bin(TimeGenerated, 24h), Computer, InstanceName
| project Computer, AvgCpu, TimeGenerated;
let MemoryData = Perf
| where ObjectName == "Memory" and CounterName == "% Committed Bytes In Use"
| summarize AvgMemory = avg(CounterValue) by bin(TimeGenerated, 24h), Computer, InstanceName
| project Computer, AvgMemory, TimeGenerated;
CpuData
| join kind=inner (MemoryData) on TimeGenerated, Computer
| project TimeGenerated, Computer, AvgCpu, AvgMemory

3. Health Checks of Session Host:
let HealthCheckIdToDescription = (idx:long) {
case(
idx == 0, "DomainJoin",
idx == 1, "DomainTrust",
idx == 2, "FSLogix",
idx == 3, "SxSStack",
idx == 4, "URLCheck",
idx == 5, "GenevaAgent",
idx == 6, "DomainReachable",
idx == 7, "WebRTCRedirector",
idx == 8, "SxSStackEncryption",
idx == 9, "IMDSReachable",
idx == 10, "MSIXPackageStaging",
strcat("InvalidNameIndex: ", idx)
)
};
let GetHealthCheckResult = (idx:long) {
case(
idx == 0, "Unknown",
idx == 1, "Succeeded",
idx == 2, "Failed",
idx == 3, "SessionHostShutdown",
strcat("InvalidResultIndex: ", idx)
)
};
WVDAgentHealthStatus
// In some states (e.g. Unavailable, Upgrading) hosts are not running health checks
| where isnotempty(SessionHostHealthCheckResult)
| mv-expand SessionHostHealthCheckResult to typeof(dynamic)
| evaluate bag_unpack(SessionHostHealthCheckResult)
| evaluate bag_unpack(AdditionalFailureDetails)
| extend HealthCheckDesc = HealthCheckIdToDescription(HealthCheckName)
| summarize count(), FirstSeen=min(TimeGenerated), LastSeen=max(TimeGenerated) by HealthCheckDesc, SessionHostName, HealthCheckResult=GetHealthCheckResult(HealthCheckResult)

4. Summary of Round-trip time and bandwidth
// Returns the 90th percentiles for round-trip time (in Milliseconds) and bandwidth (in Kilobytes) for each connection along with additional connection details.
WVDConnectionNetworkData
| summarize RTTP90=percentile(EstRoundTripTimeInMs,90), BWP90=percentile(EstAvailableBandwidthKBps,90), StartTime=min(TimeGenerated), EndTime=max(TimeGenerated) by CorrelationId
| join kind=inner
(
WVDConnections
| where State == "Connected"
| extend Protocol = iif(UdpUse in ("0", "<>"), "TCP", "UDP")
) on CorrelationId
| project UserName, SessionHostName, RTTP90, BWP90, Protocol, StartTime, EndTime, CorrelationId, ClientOS, ClientType, ClientVersion, ConnectionType, ResourceAlias, SessionHostSxSStackVersion

10. Inbuilt KQL Queries:
1. Go to the Log Analytics Workspace-->Logs-->Queries-->Azure Virtual Desktop

2. Simply hover your mouse over the desired query and click on 'Run'.

11. AVD Insights:
1. You can also come to the Insights tab. You can navigate through different tabs such as Connection Reliability, Connection Diagnostics, Connection Performance, Users, Utilization etc.

Comments
Post a Comment