6. Logging and threat detection
LT-1: Enable threat detection capabilities
Features: Microsoft Defender for Service / Product Offering
Reference: Onboard Windows devices in Azure Virtual Desktop
I have already covered the step-by-step guide for onboarding Windows devices to Defender for Endpoint. Please refer to the link for further details:
LT-4: Enable logging for security investigation
Features: Azure Resource Logs
Reference: Push diagnostics data to your workspace
Most resources in Azure generate the monitoring data for the following data types: Activity Log, Platform metrics and Resource Logs.
Create Log Analytics workspace:
Log Analytics workspace is needed to collect activity logs, diagnostic logs, performance counters and events for your Azure Virtual Desktop session hosts.
1. Search for Log Analytics in the Global Search. Click +Create.
2. Select the required Subscription, Resource Group and the Location.
3. Provide a suitable name.
4. Click Review +Create.
5. The deployment is completed.
1. Activity Log:
The Activity log provides insight into subscription-level events for Azure services including service health records and configuration changes.
1. Go to the Subscription-Activity Log-Export Activity Logs
4. Under the 'Logs' category, select all logs as per the requirements.
5. Under 'Destination details,' select 'Send to Log Analytics Workspace.' Then, choose the appropriate subscription and workspace name.
6. Click Save.
Guest OS metrics is collected through the Azure Monitor Agent that runs on or as part of the guest operating system. Guest OS metrics include performance counters that track guest CPU percentage or memory usage.
In our scenario, Resource logs refer to the logs for the host pool, application groups, and workspaces created under Azure Virtual Desktop.
Both the Guest OS metrics and Resource Logs are configured as part of setting up AVD Insights.
2.1. Azure Storage Diagnostic Settings:
1. Search for the storage account used for FSLogix user profiles. Under Monitoring, navigate to Diagnostic Settings, and then select 'File'.
3. Give a suitable name.
7. Under Logs- Category groups check the box for audit and allLogs.
8. Under Destination Details, check the box for Send to Log Analytics Workspace.
9. Select the appropriate Subscription and Log Analytics Workspace.
10. Click on Save.
2.2. Host Pool Diagnostic Settings:
1. Search for Azure Virtual Desktop in the Global search.
2. Under 'Manage', click on 'Host pools'.
6. Give a suitable name.
7. Under Logs- Category groups check the box for allLogs.
8. Under Destination Details, check the box for Send to Log Analytics Workspace.
9. Select the appropriate Subscription and Log Analytics Workspace.
10. Click on Save.
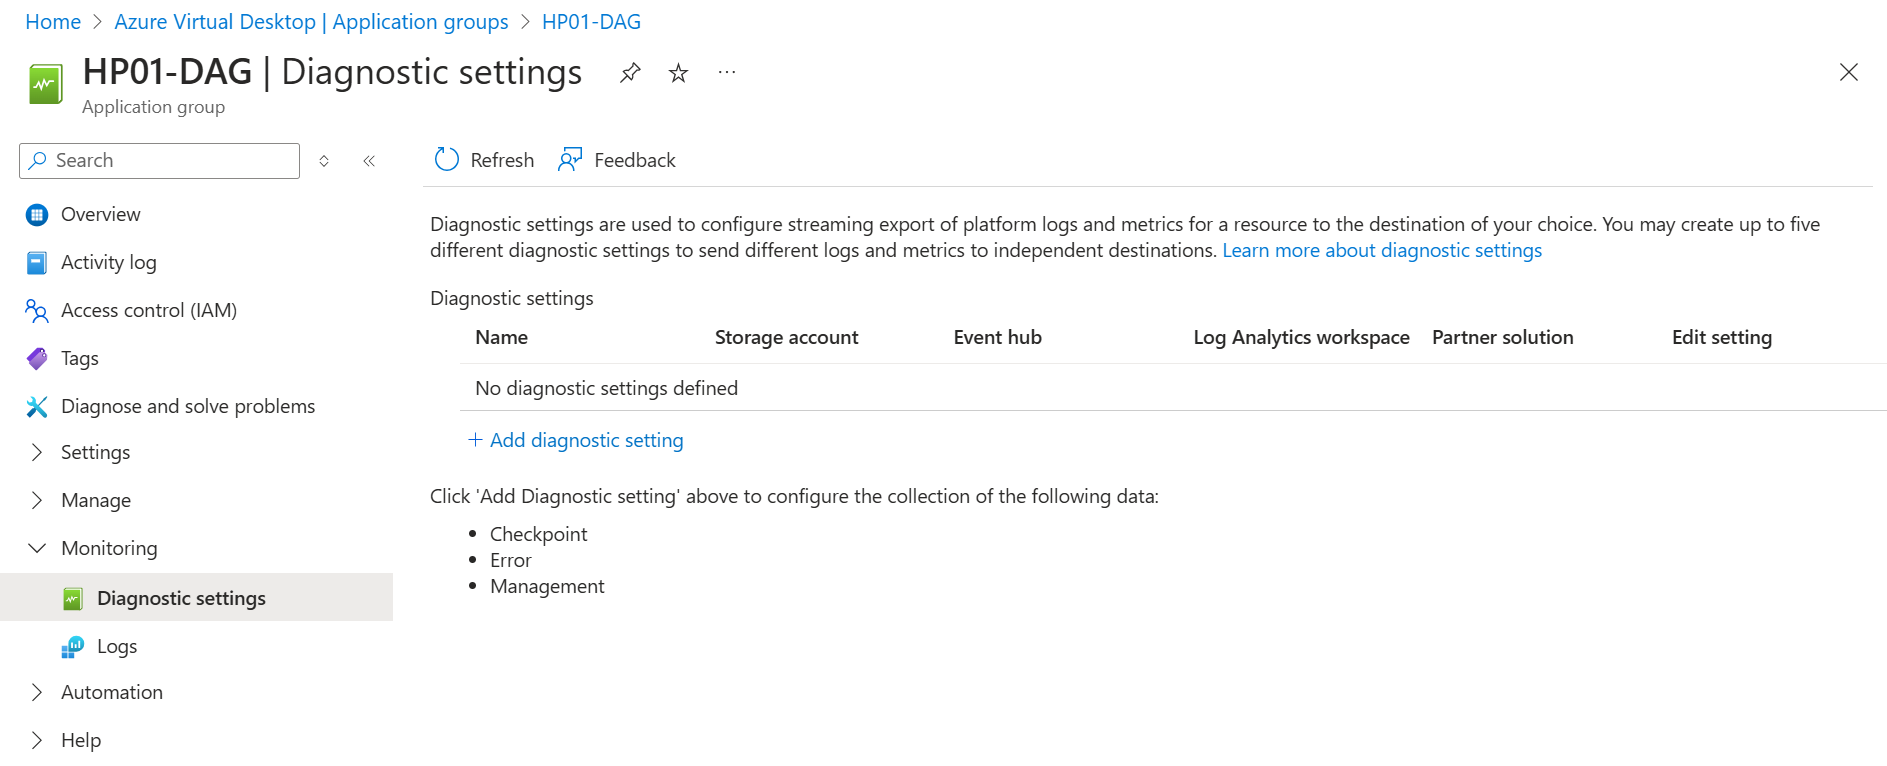
2.3. Application Group Diagnostic Settings:
1. Search for Azure Virtual Desktop in the Global search.
2. Under Manage click on Application Groups.
3. Click on HP01-DAG
4. Under Monitoring, click on Diagnostic settings.
5. Click on +Add diagnostic setting
6. Give a suitable name.
7. Under Logs- Category groups check the box for allLogs.
8. Under Destination Details, check the box for Send to Log Analytics Workspace.
9. Select the appropriate Subscription and Log Analytics Workspace.
10. Click on Save.
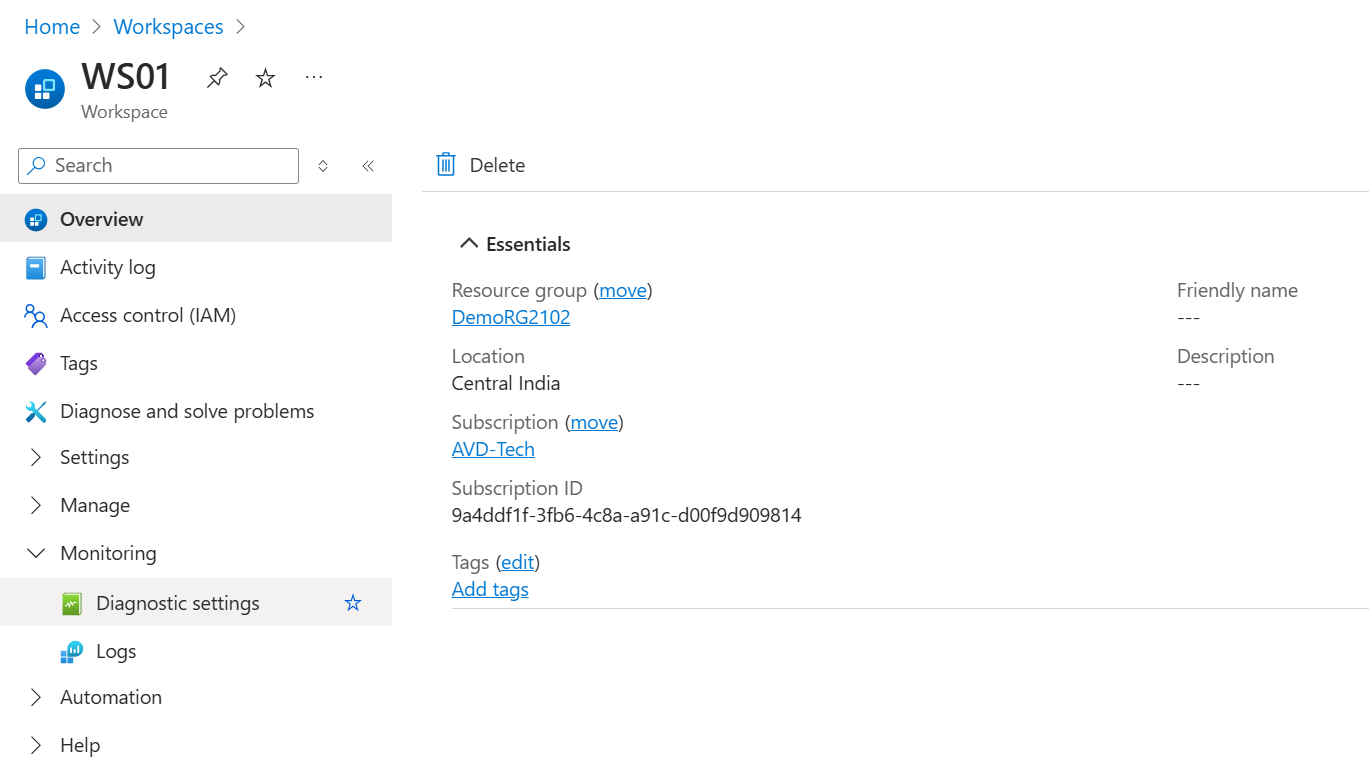
2.4. Workspace Diagnostic Settings:
1. Search for Workspace in the Global Search.
2. Select the workspace that was created.
4. Click on +Add diagnostic setting
2.5. Set up the configuration workbook:1. Search for Azure Virtual Desktop in the Global search.
2. Under Monitoring, click on Insights.
3. Scroll down to the bottom and click on Configuration Workbook.
4. Click on Session Host data settings tab.
5. Under Workspace destination select the Log Analytics workspace.
6. Click on Create data collection rule.
7. Click on Deploy.
8. Under 'Selected DCR,' select the DCR that was just created.
9. Under DCR associations, click on Deploy Association.
10. Click Deploy.
11. Scroll down a bit, under Session hosts missing Azure Monitor extension click on Add extension.
12. Click Deploy.
13. Scroll down a bit, click on Add system managed identity.
14. Click Add system managed identity.
15. Once the configurations are complete, the page should look like this:
2.6. Performance Counters and Event Logs Configuration:
1. Search for 'Log Analytics' in the global search and click on the one we created.
2. Under Settings click on Agents.
3. Click on Data Collection Rules.
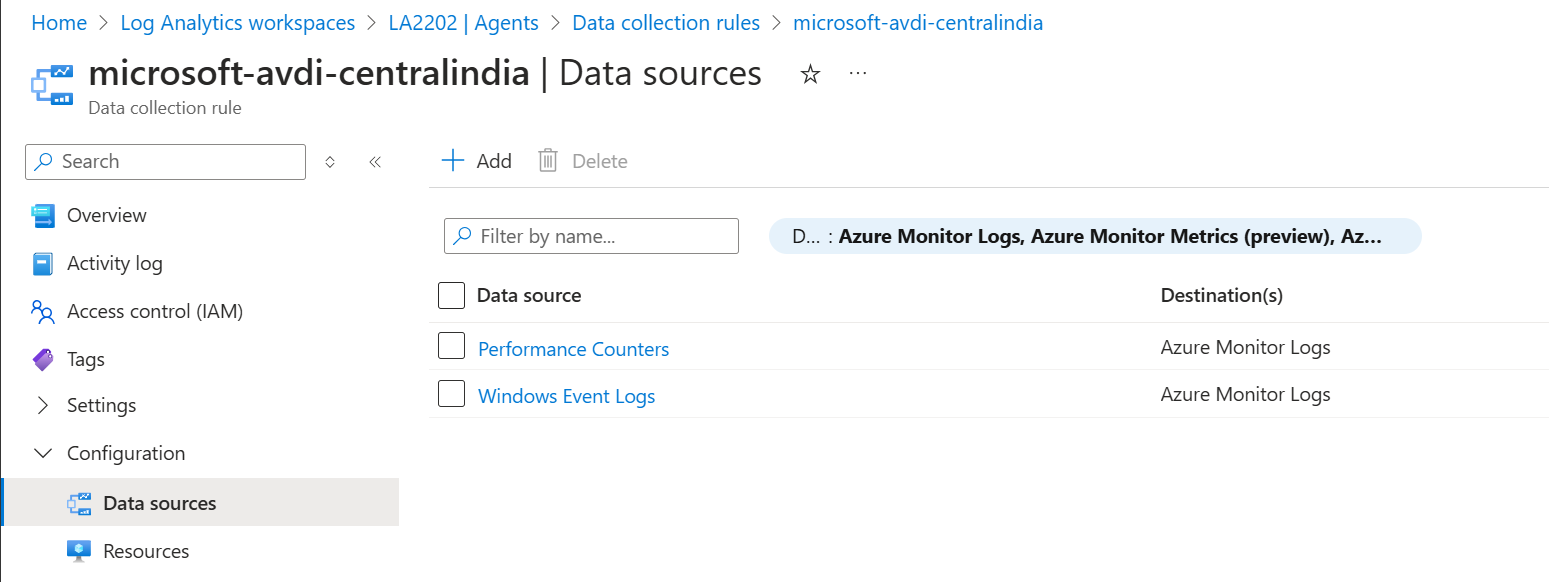
4. Click on the DCR Rule.
5. Under Configuration, click on Data sources.
6. Click on Performance Counters.
7. Under Basic tab, you can see the overall performance counters. By default the sample rate here is 60 seconds. Based on the customer requirement, it can be increased or decreased.
NOTE: The lesser the sampling rate, more the cost.
8. If you click on Custom, you will get to see what specific counters are configured for AVD. You may click on Cancel and go back.
9. Click on Windows Event Logs10. Under Basic tab, you can see the overall event logs configured.
11. Under Custom, you will get to see what specific event logs are configured for AVD. You may click on Cancel and go back.
3. Monitoring considerations for AVD:
3.1. Health and availability monitoring:
3.1.1. Service Health:
Service Health is the best place to look for notifications about events that impact your service, such as outages and planned maintenance activities.
1.Click on the Support + Troubleshooting icon, then select View Service Health.
4. Under the Condition tab, there are approximately 243 services available. You can select the required services based on your needs. I have selected only one service: Windows Virtual Desktop.
5. For Event Types, there are four options: Service Issues, Planned Maintenance, Health Advisories, and Security Advisories. I have selected all four.
7. Give a meaningful Alert Rule name.
8. Click Create.
Resource Health helps you diagnose and get support for service problems that affect your Azure resources. Information about the current and past health of your resources is reported in Resource Health. You can monitor the following resource types for resource health status:
- Azure Storage solutions for Azure Virtual Desktop FSLogix and App Attach
- Session hosts, or virtual machines (VMs)
2. If you select Storage Account, the green checkmark next to the resource indicates that there are no known Azure platform issues affecting this storage account.
3. If you select Virtual Machine, the blue "i" icon next to the resource indicates that the virtual machine is stopped/deallocated as requested by an authorized or unauthorized user or process.
4. You can also make use Log Analytics to view a count of activity log records for each category.AzureActivity
| summarize count() by CategoryValue
3.2.1. Query connection quality data:
1. List of users with their respective AvgRTT and AvgBandwidth for last 24 hours
let startTime = ago(24h);
WVDConnectionNetworkData
| join kind=leftouter (
WVDConnections
| distinct CorrelationId, UserName
) on CorrelationId
| where TimeGenerated >= startTime
| summarize
AvgRTT = avg(EstRoundTripTimeInMs),
AvgBandwidthMbps = avg(EstAvailableBandwidthKBps) * 8 / 1024
by UserName
2. Average RTT and Bandwidth in Mbps for a specific user over the last 24 hours.
let user = "annie@cloudazure.co.in";
let startTime = ago(24h);
WVDConnectionNetworkData
| join kind=leftouter (
WVDConnections
| distinct CorrelationId, UserName
) on CorrelationId
| where UserName == user and TimeGenerated >= startTime
| summarize
AvgRTT = avg(EstRoundTripTimeInMs),
AvgBandwidthMbps = avg(EstAvailableBandwidthKBps) * 8 / 1024
3. Top 10 users with the highest round trip time:
WVDConnectionNetworkData
| join kind=leftouter (
WVDConnections
| distinct CorrelationId, UserName
) on CorrelationId
| summarize AvgRTT=avg(EstRoundTripTimeInMs),RTT_P95=percentile(EstRoundTripTimeInMs,95) by UserName
| top 10 by AvgRTT desc
3.2.2. AVD Health Checks:
1. Health Checks of Session Host
let HealthCheckIdToDescription = (idx:long) {
case(
idx == 0, "DomainJoin",
idx == 1, "DomainTrust",
idx == 2, "FSLogix",
idx == 3, "SxSStack",
idx == 4, "URLCheck",
idx == 5, "GenevaAgent",
idx == 6, "DomainReachable",
idx == 7, "WebRTCRedirector",
idx == 8, "SxSStackEncryption",
idx == 9, "IMDSReachable",
idx == 10, "MSIXPackageStaging",
strcat("InvalidNameIndex: ", idx)
)
};
let GetHealthCheckResult = (idx:long) {
case(
idx == 0, "Unknown",
idx == 1, "Succeeded",
idx == 2, "Failed",
idx == 3, "SessionHostShutdown",
strcat("InvalidResultIndex: ", idx)
)
};
WVDAgentHealthStatus
// In some states (e.g. Unavailable, Upgrading) hosts are not running health checks
| where isnotempty(SessionHostHealthCheckResult)
| mv-expand SessionHostHealthCheckResult to typeof(dynamic)
| evaluate bag_unpack(SessionHostHealthCheckResult)
| evaluate bag_unpack(AdditionalFailureDetails)
| extend HealthCheckDesc = HealthCheckIdToDescription(HealthCheckName)
| summarize count(), FirstSeen=min(TimeGenerated), LastSeen=max(TimeGenerated) by HealthCheckDesc, SessionHostName, HealthCheckResult=GetHealthCheckResult(HealthCheckResult)
2. You can also navigate to the individual session to check the VM status.
3.2.3. CPU and Memory usage:
1. Avg. CPU and Memory for the given session host in last 48 hrs:
let CpuData = Perf
| where ObjectName == "Processor Information" and CounterName == "% Processor Time"
| summarize AvgCpu = avg(CounterValue) by bin(TimeGenerated, 24h), Computer, InstanceName
| project Computer, AvgCpu, TimeGenerated;
let MemoryData = Perf
| where ObjectName == "Memory" and CounterName == "% Committed Bytes In Use"
| summarize AvgMemory = avg(CounterValue) by bin(TimeGenerated, 24h), Computer, InstanceName
| project Computer, AvgMemory, TimeGenerated;
CpuData
| join kind=inner (MemoryData) on TimeGenerated, Computer
| project Computer, AvgCpu, AvgMemory, TimeGenerated
3.2.4. AVD utilization:
1. Active Users List
let CompletedIDs = WVDConnections
| where State == "Completed"
| project CorrelationId;
WVDConnections
| where CorrelationId !in (CompletedIDs)
| where State != "Started"
| project UserName, State, TimeGenerated
2. Top 10 connection errors:
WVDErrors
| where ServiceError == "false"
| where ActivityType == "Connection"
| summarize UserCount = dcount(UserName), SampleMessage = take_any(Message) by CodeSymbolic
| project SampleMessage, UserCount
| top 10 by UserCount desc
3. List of all users successfully completed AVD sessions
WVDConnections
| summarize SessionStart = min(TimeGenerated), SessionEnd = max(TimeGenerated) by UserName, SessionHostName, CorrelationId
| extend SessionDuration = datetime_diff('minute', SessionEnd, SessionStart)
| where SessionDuration > 0 // Exclude sessions with duration = 0
| order by SessionEnd desc
3.2.5. FSLogix:
You can dive deeper into FSLogix-related errors.
Event | where EventLevelName == "Error"
| where Source == "Microsoft-FSLogix-Apps"
3.2.6. Windows Event Logs:
1. Count of Windows error events by source.
Event | where EventLevelName == "Error" | summarize count() by Source
3.2.7. Storage Capacity:
1. You can check the available capacity of the Azure File Share by navigating to the Insights tab within the Storage account
3.2.8. Monitor Agent updates:
1. Query to see when an update becomes available
WVDAgentHealthStatus
| where TimeGenerated >= ago(30d)
| where SessionHostName == "AVDVM-0.cloudazure.co.in"
| project TimeGenerated, AgentVersion, SessionHostName, LastUpgradeTimeStamp, UpgradeState, UpgradeErrorMsg
| sort by TimeGenerated desc
| take 1
WVDAgentHealthStatus
| where TimeGenerated >= ago(30d)
| where SessionHostName == "sessionHostName"
| project TimeGenerated, AgentVersion, SessionHostName, LastUpgradeTimeStamp, UpgradeState, UpgradeErrorMsg
| summarize arg_min(TimeGenerated, *) by AgentVersion
| sort by TimeGenerated asc
3.2.9. Monitor Auto scale operations:
Autoscale diagnostic data, integrated with Insights in Azure Virtual Desktop, enables you to monitor scaling operations, identify issues that need to be fixed, and recognize opportunities to optimize your scaling plan configuration to save cost.
1. The data is written to the WVDAutoscaleEvaluationPooled table.
Azure Virtual Desktop Insights
If you don’t want to query the tables, you can use the Insights tab in Azure Virtual Desktop, which provides a quick overview of all insights through graphs, pictorial representations, and more.
You can access the Insights tab and navigate through different sections such as Connection Reliability, Connection Diagnostics, Connection Performance, Users, Utilization, and more.


Comments
Post a Comment